
Pilothouse Marine Services
Marine Thermal Imaging & Infrared Thermography
Thermal imaging makes surface temperature patterns visible, helping investigate conditions that may not be apparent during a visual inspection. Infrared thermography combines those images with measurements, operating conditions, and analysis to interpret what the patterns may indicate.
Pilothouse Marine Services provides separate thermal imaging assignments for vessel owners, boatyards, and insurance companies. An assignment may investigate a known concern, follow up on a survey finding, or assess electrical, mechanical, or composite components.
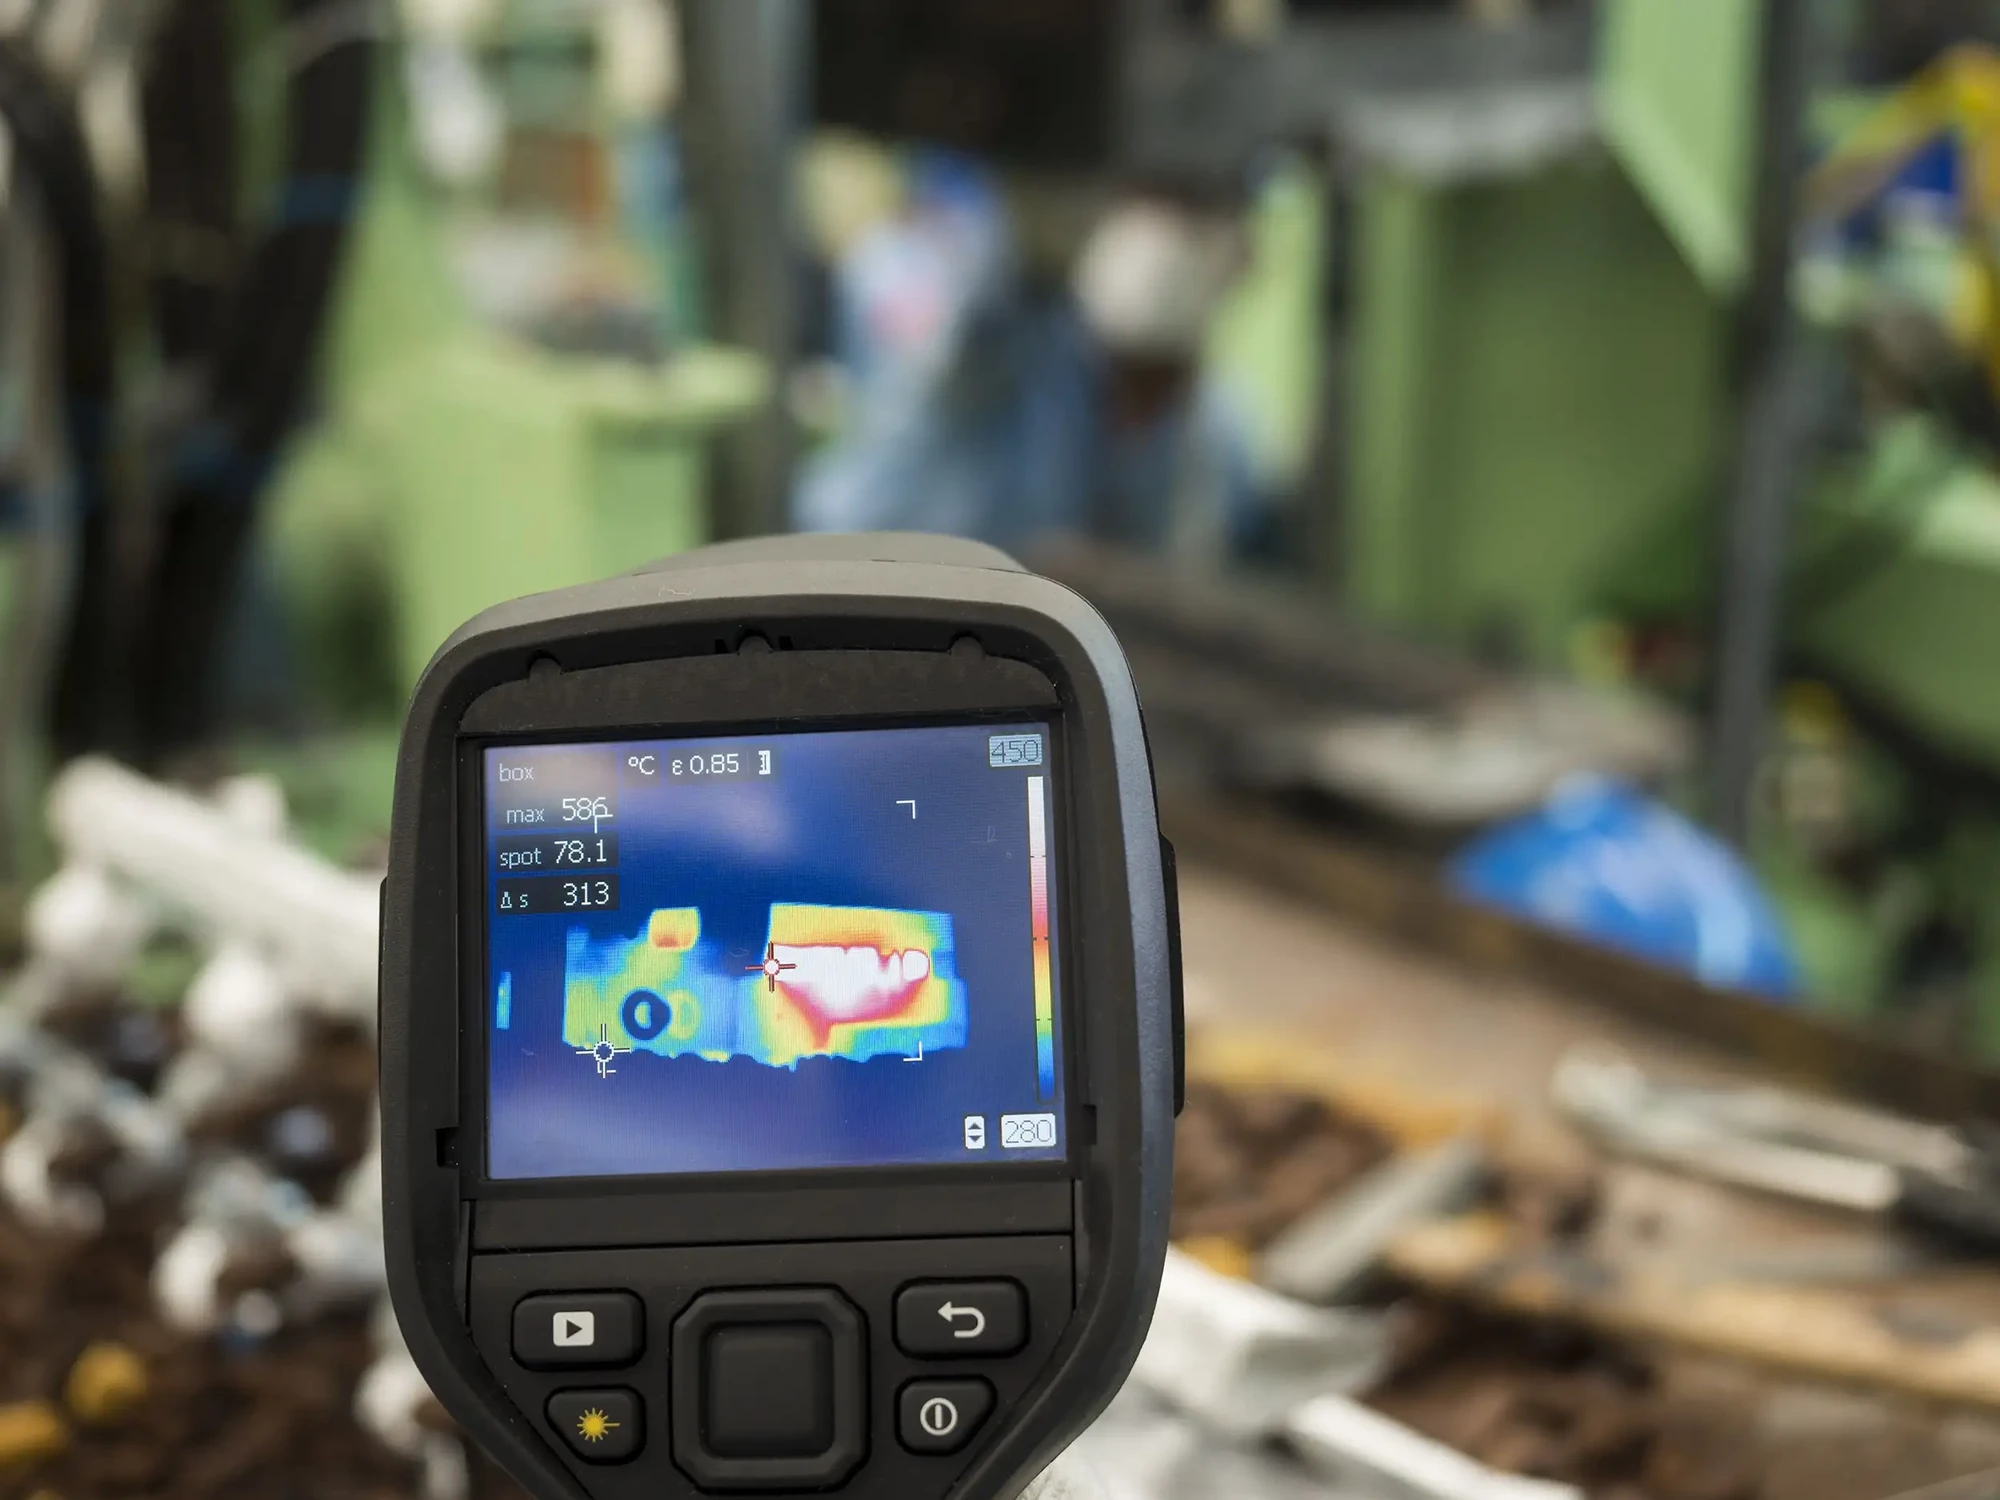
What is thermal imaging?
Infrared thermography is one of the most valuable non-destructive diagnostic tools used on both commercial and recreational vessels. Thermal imaging allows abnormal heat patterns to be identified in electrical, mechanical, and structural systems that may not be visible during a standard visual inspection.
By detecting temperature anomalies that are usually invisible to the naked eye, thermal imaging allows corrective action to be taken before costly system failures occur.
Thermal imaging cameras convert the energy in the infrared wavelength into a visible light display, called thermograms.
At Pilothouse Marine Services, we offer three basic thermal imaging services that match up with a typical vessel: electrical, mechanical, and composite materials.
Applications
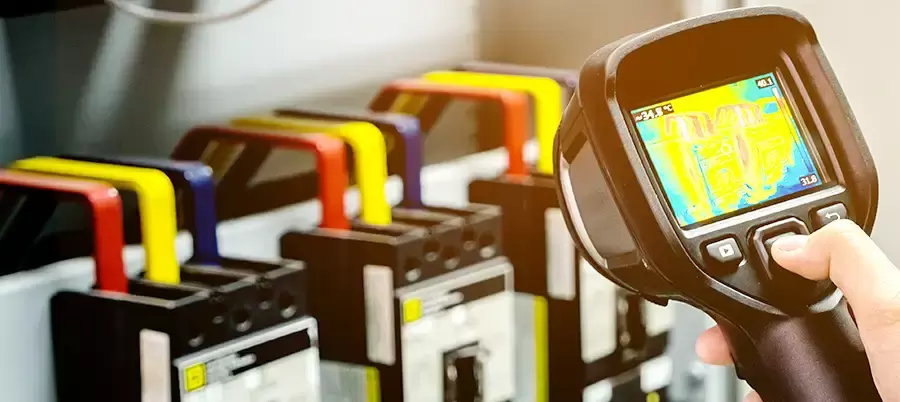
Electrical systems
Monitor and diagnose the condition of electrical installations and components.
Discover hot spots. Take corrective actions.
Typical elements
- Direct Current (DC) systems
- DC electric panels, batteries, and bundled wires
- DC equipment (electronics, winches, windlass, lights)
- Alternating Current (AC) systems
- AC panels, shore power, house power, and bundled wires
- AC equipment (inverters, galley, refrigeration, A/C)
When performed
- Preventative Maintenance Program
- To baseline the installed system
- Investigative (troubleshoot current issues)
- Sea trials (new construction or post yard work)
- Prior to yard period to identify repair work
- Follow-up after repair work has been performed
Inspection process
- Data is captured against all possible power sources appropriate to the vessel (shore power, generator, inverter, batteries)
- Each system is operated under typical loads
- Image capture is performed
- Data analysis and report generation
- Debrief with owners, captains, maintenance supervisors, yard manager, and repair technicians
Applications
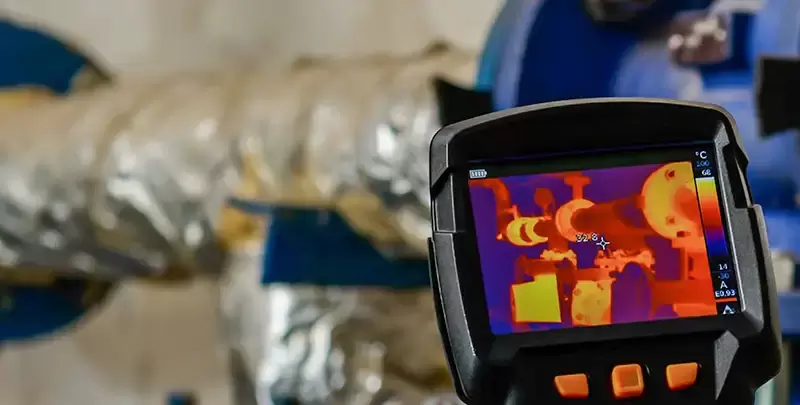
Mechanical systems
Scan and visualize the temperature distribution of entire surfaces of machinery.
Avoid costly equipment breakdowns.
Typical elements
- Electric motors
- Internal combustion engines (mains, generators)
- Bearings (motors, pillow block, shaft, etc.)
- Couplers
- Tanks, piping, valves
- Exhaust system and components
When performed
- Preventative Maintenance Program
- To baseline the installed system
- Investigative (troubleshoot current issues)
- Sea trials (new construction or post yard work)
- Prior to yard period to identify repair work
- Follow-up after repair work has been performed
Inspection process
- Systems should be aligned and operated in typical underway modes for the specific vessel
- Loads should vary from normal to high
- Image capture is performed
- Data analysis and report generation
- Debrief with owners, captains, maintenance supervisors, yard manager, and repair technicians
Applications
Composite materials
Moisture, delamination, voids, and other common issues can be “seen” as thermal differences.
Far advanced to the typical “moisture meter”. Visualize defects, moisture, or impact damage that would not have been possible without destructive efforts such as coring or drilling.
Typical elements
- Fiberglass-reinforced hulls, decks, and components
- Liquid intrusion
- Osmotic blisters
- Delamination or disbonding
- Voids
- Wooden boat hulls: moisture accumulation, open seams between planking, and mechanical fasteners
When performed
- Investigative (extent or degree of moisture)
- Map out areas of moisture intrusion
- Surveys: to confirm or disprove wet decks, core, hull
- Post-damage analysis (impact, hurricanes, lightning)
- Composite layup or infusion
Inspection process
- Visual inspection inside and out
- Consult vessel drawings
- Apply uniform heat to the area being imaged
- Image capture is performed
- Data analysis and report generation
- Debrief with owners, captains, maintenance supervisors, yard manager, and repair technicians
- Coring or other destructive testing may be required to confirm
A fire-pump example
From thermal image
to interpretation
Initial observation and comparison
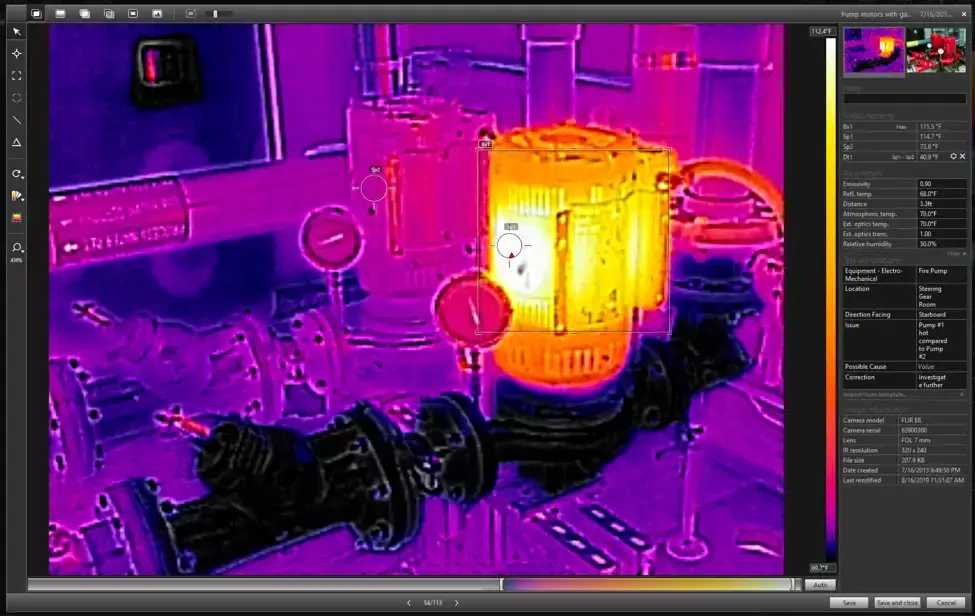
The image displays two electric-motor-driven fire pumps in the aft steering gear room. Both pumps are energized.
Pump #1 in the foreground is displaying a higher thermal image (more heat) than pump #2 in the background. With the color palette selected, hotter temperatures are lighter colored and cooler temperatures are darker colors.
If both pumps are running under similar load characteristics, we expect them to be approximately the same temperature.
At this stage, this is qualitative thermography.
When we spot an anomaly such as this during our infrared survey, we then take multiple images and analyze them in our advanced software tools.
Measurements and temperature differences
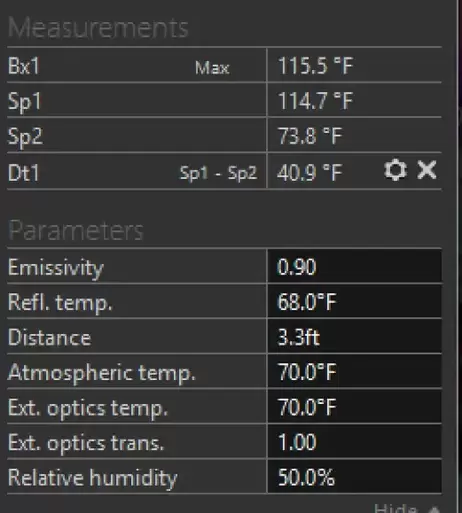
The snapshot shows just some of the basic parameters and measurements we can capture within the software by analyzing the radiometric image.
We are now in the quantitative thermography stage.
- Bx1 is a box measurement drawn around the electric motor and captures maximum, minimum, and average temperatures.
- Sp1 and Sp2 are spot measurements. Notice Sp1 is on pump #1 and Sp2 is on pump #2.
- Dt1 is a Delta reading. It clearly shows that pump #1 is running 40.9 degrees warmer than pump #2.
| Label | Measurement | Value |
|---|---|---|
| Bx1 | Max | 115.5 °F |
| Sp1 | Sp1 | 114.7 °F |
| Sp2 | Sp2 | 73.8 °F |
| Dt1 | Sp1 – Sp2 | 40.9 °F |
Interpretation and potential causes
Possible causes include an alignment issue, a bearing issue, or a motor electric winding issue.
It could also be friction or a restriction in the actual pump or piping that is placing an increased load on the electric motor.
This type of issue would not have been noticed under normal circumstances until the issue manifested itself in a motor failure, loss of fireman pressure, or possible fire.
Recommended further investigation
Further investigation will include taking and analyzing images of the most common failure points (not shown in this image). These include motor-to-pump mounting, the bearings, and the motor body.
We will recommend to the client that the fire pump be taken offline and further investigation performed.
The technology
Understanding infrared thermography
Infrared radiation and temperature patterns
All objects above absolute zero emit thermal infrared energy, so thermal cameras can passively see all objects, regardless of ambient light. The amount of radiation emitted from an object increases with temperature; therefore, thermography allows us to see variations in temperatures. When viewed or captured through a thermal imaging camera, warm objects stand out well against cooler backgrounds.
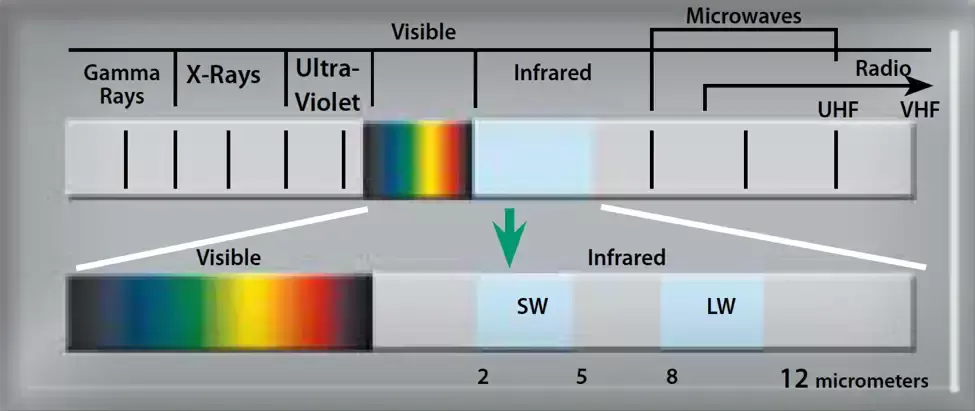
The electromagnetic spectrum
Our eyes are detectors that are designed to detect electromagnetic radiation in the visible light spectrum. All other forms of electromagnetic radiation, such as infrared, are invisible to the human eye.
Infrared radiation lies between the visible and microwave portions of the electromagnetic spectrum. The primary source of infrared radiation is heat or thermal radiation. Any object that has a temperature above absolute zero (-273.15 degrees Celsius or 0 Kelvin) emits radiation in the infrared region. Even objects that we think of as being very cold, such as ice cubes, emit infrared radiation.
Camera capabilities and specifications
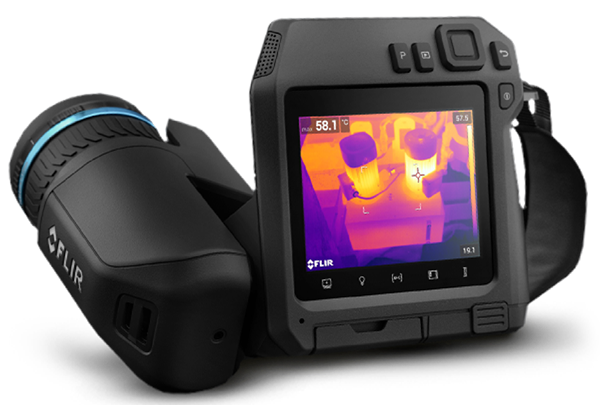
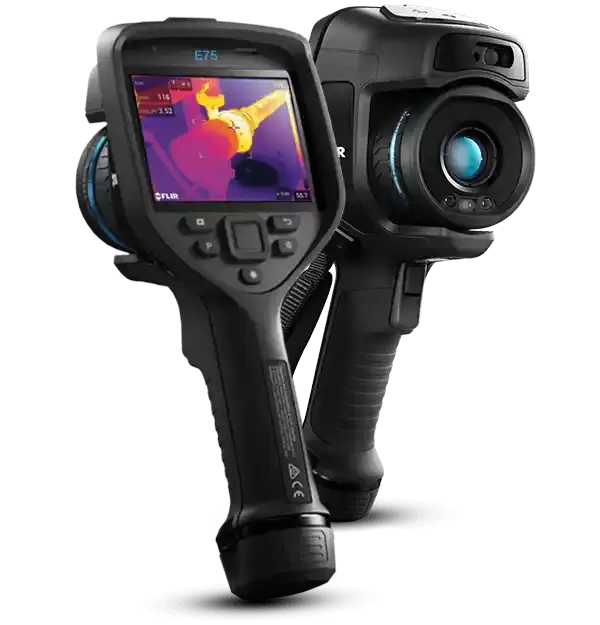
Our high-resolution thermal imaging cameras from FLIR are reliable non-contact instruments which are able to scan and visualize the temperature distribution of entire surfaces of machinery, electrical equipment, and fiberglass hulls and decks quickly and accurately.
- Resolution
- Up to 161,472 pixels in an image. Each pixel is a radiometric measurement point and contains detailed data for the image.
- Thermal sensitivity
- Describes how small a temperature difference the camera can detect. Our cameras have a thermal sensitivity down to 0.03°C.
- Object temperature range
- -20°C to 120°C (-4°F to 248°F)
0°C to 650°C (32°F to 1202°F)
300°C to 1500°C (572°F to 2732°F) - Accuracy
- ±2°C (±3.6°F) or ±2% of reading
Available image presentation modes
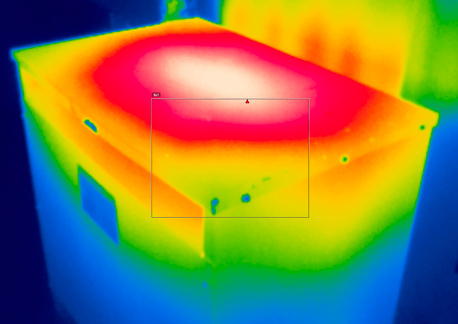
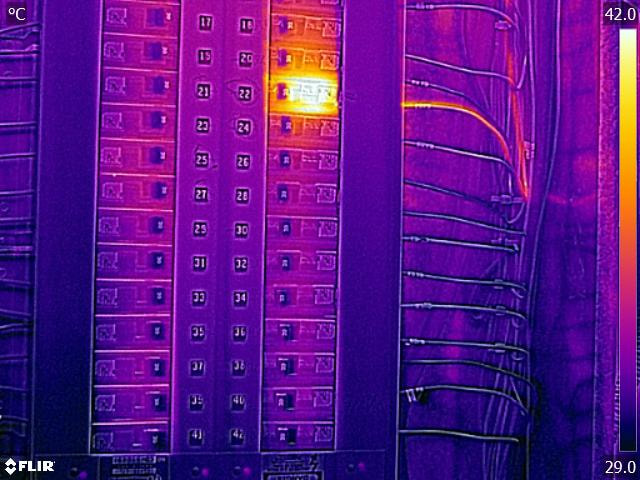
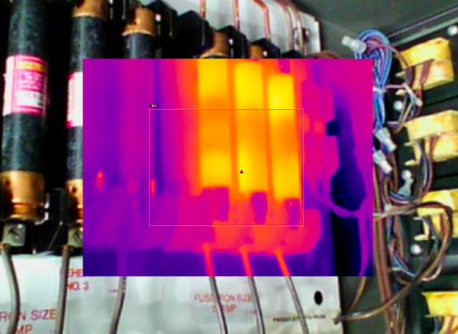
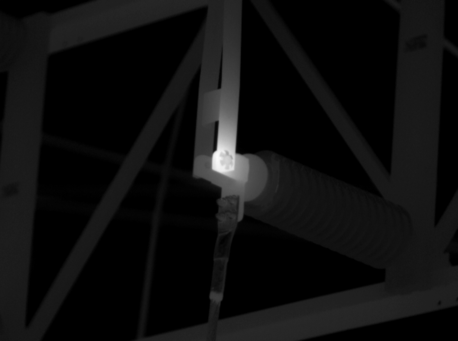
The pictures below are examples of the various image modes we can use to best depict the thermal details of the object.
Analysis and reporting
Thermal analysis
and reports
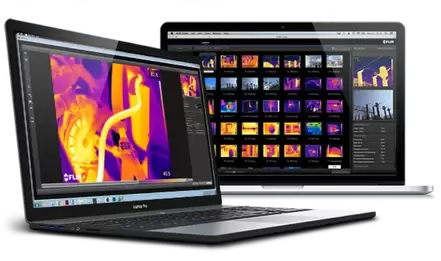
Once all the images and videos are captured aboard your vessel, we load those files into our analysis software. From there we can use the advanced features to help with:
- The overall analysis
- Select the image type and color palette to best represent the object
- Apply various measurement points
- Calculate Delta T values
- Compare thermal patterns of similar equipment (or before-and-after shots)
- Select the tables and templates of data elements to include with the report
- Output data files to create graphs
- Process the hundreds of images into our customer reports
Electrical and mechanical can be combined in a whole-vessel Preventative Maintenance Program. These services are priced either on a per-vessel basis or by the hour, whichever best meets your needs, the situation, or the scope of work.
Discuss a Thermal Imaging Assignment
Contact Pilothouse Marine Services with the vessel’s details, location, and the equipment or area of concern. Include any relevant survey findings, operating symptoms, or repair history so the scope of the assignment can be discussed.